
Quadratic RELATIONS
How to Graph Parabolas
Graphing parabolas is not that complicated once you understand the concept of describing the transformations.
There are three ways to graph..
1) Describing the transformations
2) Mapping notation
3) Step pattern
Mapping Formula: (x+h) (ay+k)
Part 1: For the following, write the mapping formula: Example: y= (x-8)^2+5 a=1 h=8 k=5 (x+8, y+5)
a) y= (x+4)^2+2
b) y= (x-7)^2-7
c) y= -0.5(x-8)^2+1
d) y= 2(x-9)^2+8
Part 2: For the following questions
1) Write the mapping formula
2) Complete a table of values for the key points for the base function, y=x2
3) Determine the transformed "key" points
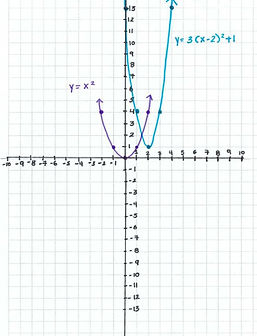
4) Stetch the base function, y=x2
5) Stetch the new graph
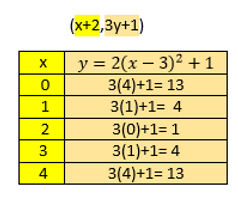
Example 1: y=3(x-2)^2+1
Mapping Notation(x,y) (x+2, 3y+1)
Table of Values for the base parabola (y=x2) Transformed "key" point table of values
Now using the table of values
of the base parabola you sub in the
points into the mapping notation formula.
Graph:
Now lets try!
a) 0.5(x+2)^2-6 b) -4(x-6)^2+2
Step Pattern:
Example 1: Stetch the graph y= 3(x-2)+4

Vertex: (2,4)
Value of a: 3
Step1= 1x3= 3
Step2= 3x3= 9
Step3= 5x3=15
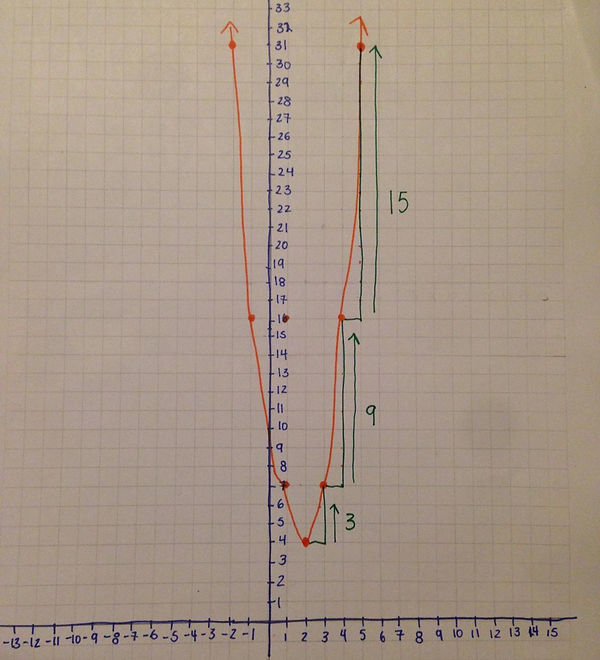
Step #1: Start off graphing the vertex
Step #2: Move a space right and increase by 3
Step #3: Move a space right and increase by 9
Step #4: Move a space right and increase by 15
*If the steps were negative you would decrease by the numbers by completing the step pattern*